Sunday, April 5, 2015

Students and their own Conjectures

I recently read an article called "Using Conjectures to Teach Students the Role of Proof" by Rhonda Cox. It talks about how she prefers to teach proofs to her students. She taught students proofs different from the way it was traditionally taught. Traditionally, the teacher gives the students a statement and asks the students to prove it. Since the teacher asked the students to prove the statement, they assume it must be true. Rhonda did not find that to be an effective teaching strategy. Instead, she allowed her students to come up with their own conjectures and prove those. She said that most most students understood proofs better even though they still did not like doing them.

I believe that this teaching style for proofs can be used for all kinds of topics in mathematics. It allows students to explore and not be spoon fed answers. I believe it can me more enjoyable for students. I would imagine there are not a lot of us who enjoy sitting around taking notes while the teacher or professor lectures. This idea of exploration can be very powerful because it prevent memorization. If a student is simply told something they will have to try and memorize it. If they figure it out themselves, they will retain the information better because they will know how to find it and understand it better.

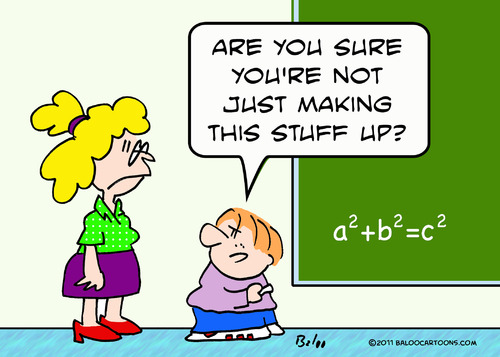
What happens when you try and memorize

A perfect opportunity to use this teaching style was missed by the teacher I am currently observing at Jenison High School. They were learning about the rules for combining exponents. This was a perfect chance to have students explore how exponents combine.

Some of the rules taught were:
You can only combine exponents when they have the same base

(x^a)(x^b) = (x^(a+b))

(x^a)/(x^b) = (x^(a-b))

x^(-a) = 1/x^a

(x^a)^b = x^(ab)

(x/y)^a = (x^a/y^a)

After they were taught all of these rules, they were given a worksheet and practice these rules. It seemed almost too simple. They were given a sheet that had all of the rules on it. While doing the practice worksheet, they used their rules sheet and basically copied the rules over.


I believe if the students were given some time they could have figured these rules out themselves. As a teacher I would have prompted them by saying "Keep the base the same, and what rules you can find about exponents. Adding? Subtracting? Multiplying? Others?" This gives them an idea of what to look for but forces them to find the answer. I believe students would remember that activity better then me simply standing at the front of the class and saying these rules work because I said so.


I think this idea can work with every concept in math. As teachers we always talk about how we don't want to simply tell student the answer. We want them to think critically and not simply memorize what we teach them. I believe that using this technique of having the students come up with their own conjectures eliminates memorization to some degree. Students will remember something better if they themselves came up with the answer in the first place. As Rhonda Cox found out, students may not like learning the material, but they will understand it better.

Monday, March 23, 2015

Technology in Class

As I was leaving the class that I observe, the teacher informed me that she would not be in the classroom the following week. I asked her why. She said that she was going to the MACUL conference in Detroit. I decided to do some research on MACUL.

MACUL Conference

MACUL stands for Michigan Association for Computer Users in Learning. It is a non-profit organization that is dedicated to assisting the education community through support, promotion, and leadership in the effective use of educational technology. Their mission statement is "MACUL ignites learning through meaningful collaboration and innovation."

 Many teachers go to the conference and a lot give presentations about how they have used a new technology in their classroom. These presentations allow teachers to share their ideas for other teachers to try and use. A conference like this encourages teachers to go find new ways to use technology in the classroom to benefit their students. They even allow student majoring in education to go as well. Next year they are coming to Grand Rapids and I think it would be something great to go to. I could learn a great deal from all these teachers.

Technology I have seen/used

I am currently observing in Mrs. Terrigno's Algebra and Geometry classes at Jenison High School. She use a lot of technology that can be quite helpful for students and her as well. One of the coolest resources she has used is infuselearning.com. Each student is given an iPad and goes to the site. They sign into her class so she can see their work. She puts a problem  on the board, they work on the problem on the iPad, then they send the work to her. This allows Mrs. Terrigno to see how each student is doing. She told me that if just a few students get the question wrong, she will individually help them. If she notices that most of the class is getting the incorrect answer, she will go over the problem with the whole class. There is an example below.


 A much more simple technological resource that Mrs. Terrigno uses is a desk projector. Sometimes she gives out story problems that involve more complicated pictures. These would be hard to draw on a whiteboard and could confuse students. Instead she can do the example on the paper and reference the picture. This allows the students to visually see how Mrs. Terrgino uses the picture to solve the problem. Another use for the desk projector is showing functions in the calculator. Calculators have many functions and some are hard to find or use. Using the projector to show the students what buttons to press is much easier than trying to explain how to use the function.


Two resources we have used in my Math 229 class are Desmos and Geogebra. They are both computer programs that allow you to visualize functions that you type in. In geogebra you can set up animations that show what happens when you change certain variables. You can set up games.


 The example above is a football animation. You have to set all of the conditions and see if the quarterback can throw an accurate pass to his wide receiver.

In Desmos it is easier to create fun pictures like the batman symbol.


Pros of Technology 


1. Technology can make things easier. Using the infuselearning.com allows a teacher to see which students are struggling easier. If the whole class understands, you can move on.

2. Programs like Desmos and Geogebra allows students to experiment. They set up animations and can experiment what happens when certain variables change. Students can start to pick up on patterns easier this way.

3. Visualizing is easier. In Desmos and Geogebra students can visualize what functions they are using. Again they can pick up on these patters to create fun pictures or animations.

Cons of Technology


1. Technology can distract students. Many times I saw students going on Facebook or other sites when using the iPads.


2. Students can improperly use technology. As you saw in the example of infuselearning.com, a student had drawn a face. Even though that's not what the student was supposed to draw, there is nothing the teacher can do from stopping something like that from happening.

3. Technology can be confusing. My first times using Desmos and Geogegra were very frustrating because I didn't know how to use the programs. I didn't really learn much at first because I was spending the whole time trying to figure out how the program works.

Overall

In the end I would say that technology is overall a good thing to have in the classroom. Teachers need to make sure that they are using technology effectively. To do this they must try maximize the pros of technology and minimize cons of technology. The technology should make the learning process fun and easier. If the technology is distracting and confusing, then there is no point in using it.  An effective teacher knows how to use technology effectively.


Sunday, March 8, 2015

Baseball Statistics

There are many stats in the game of baseball. There are stats for fielders, pitchers, and hitters. Most of these are calculated by simply counting the number of times they happen. Examples of these stats are homeruns, stikeouts, RBIs, walks, hits, ect. There are some stats that require calculations. These are the stats I would like to discuss.

Hitters

Batting Average

Any baseball fan knows what a batting average is. It is the single most important stat for a hitter. A hitter with a low batting average is not a valuable asset to any team, regardless of his other stats. A players batting average is calculated by taking the number of times the player gets a hit and dividing by the total number of at bats for that player. Walks do not count as at bats in baseball. Lets say a player gets 4 at bats for in a game. In the game he gets 2 hits. So his batting average for that game is 2/4 or 0.500.

 
Above is Hall of Famer Ty Cobb. He is the all time leader in batting average for a career. He played for 24 years with the Tigers and the Athletics and had an impressive 0.366 batting average for his career.

On Base Percentage

On base percentage is similar to batting average. The only difference is that on base percentage takes into account errors and walks. If a player reaches base safely due to a walk, his on base percentage will go up but his batting average will remain the same. For example, lets say a player gets 10 at bats. He gets 6 hits, 2 walks, and 1 base by error. His batting average would be 6/8 or 0.750 while his on base percentage would be 9/10 or 0.900.

Slugging Percentage

Slugging percentage in a little more confusing than the previous 2 stats. Slugging percentage measures the power of a hitter. It takes into account whether the hitter gets singles, or something more than a single. Each hit does not count equally like it does in batting average. Slugging percentage is calculated:

SLG = \frac{(\mathit{1B}) + (2 \times \mathit{2B}) + (3 \times \mathit{3B}) + (4 \times \mathit{HR})}{AB}


1B, 2B, 3B, and HR stand for single, double, triple, and home run. Notice that the farther you get around the bases, higher your slugging percentage will be. Players who hit a lot of home runs often have high slugging percentages.

The guy to the left is Babe Ruth. One of the most iconic players in the history of baseball. n 1920, Babe Ruth played his first season for the New York Yankees. In 458 at bats, Ruth had 172 hits, comprising 73 singles, 36 doubles, 9 triples, and 54 home runs, which brings the total base count to (73 × 1) + (36 × 2) + (9 × 3) + (54 × 4) = 388. Divide that by 458 at bats and you get a 0.847 slugging percentage.  That was quite impressive.


Then this guy to the right showed up and beat that record in 2001. Barry Bonds is also an iconic player, but for bad reasons. HE IS A CHEATER! HE TOOK STEROIDS AND WE ALL KNOW IT!! In 2001, Bonds racked 411 bases in 476 at bats which came to a 0.863 slugging percentage. That record still stands today


Pitching

Earned Run Average (ERA)

A pitcher's ERA is his most important stat. It is the average number of runs given up per nine innings by a pitcher. Starting pitchers who have the lowest ERAs are often up for the Cy Young Award which is given to the best pitcher in each league. ERA is calculated by taking the amount of earned runs, dividing it by the total number of innings pitched, and multiplying by 9. An earned run is only scored if there are no defensive errors. Let's say a batter hits the ball and it goes through a fielders hand. That is an error. If another player scores off of that error, a pitcher's ERA is not effected. If a pitcher pitches 30 innings and gives up 4 runs his ERA would be (4/30) * 9 = 1.19 which is pretty good.


Justin Verlander won the 2011 American League CY Young. He led the league with a 2.40 ERA. This stat, along with others, allowed him to be the first pitcher since 1986 to win the MVP award.

Walks plus Hits per Inning (WHIP)

A pitchers WHIP shows how efficient he is pitching. It shows how many base runners per inning a pitcher allows. Pitchers with lower WHIPs often pitch more innings since they do not give up as many base runners. WHIP is calculated by adding the amount of hits and walks a pitcher gives up and diving that by the number of innings pitched. If a pitcher pitches 50 innings and gives up 12 hits and 4 walks then his WHIP is (12+4)/50 = 0.320 which is not very good. Justin Verlander also had an impressive WHIP in 2011 which allowed him to win the Cy Young and MVP.


Many stats in sports are simply figured out by counting how many times they happen. In football there are many counting stats like touchdowns, yards, tackles, and interceptions. Hockey there are goals, assists and points. Those are major stats in their respective sports but they don't require any math, any calculation. Some of the most important stats in baseball require mathematical calculation.

Tuesday, February 17, 2015

A Bus Accident

In 9 days it will be the 2 year anniversary of the day I got into a major car accident with a bus. On February 26, 2013 I was driving back from the GVSU grand rapids campus towards the Allendale campus. I was sitting passenger seat while a friend of mine was driving. There was lot of snow on the roads that day. As we were coming around a curve on Lake Michigan Drive, we lost control and went into oncoming traffic. We crashed into a Grand Rapids bus.

  http://fox17online.com/2013/02/26/bus-crashes-near-grand-valley-state-university/

The above is a link to one of the stories that was written on the local news website. Unfortunately I could not find a picture of the car. Lets just say my friends could not believe I survived when they saw the pictures of the car.


 Imagine going head on into one of these bad boys. The injuries I suffered were a spline and liver laceration, a bruised left lung and a mesenteric-haematoma. My friend walked away with a few scratches.

What I have always wanted to do is calculate the amount of momentum that was applied to the car and onto myself. This can be done using math and physics. We know that we can find the momentum of both the bus and the car I was in. Momentum is defined as:

p = mv
where p: momentum
           m: mass
           v: velocity

We can look up the mass of the grand rapids bus and the car I was in. The car I was in was a Pontiac Sunfire.


Mass of Grand Rapids Bus: 40000 lbs or 18143 kg
Mass of Pontiac Sunfire: 2606 lbs or 1182 kg

I can take a pretty good guess that we were both moving at around 25 mph at the point of the accident. That is about 11 m/s.

Momentum of the Pontiac Sunfire =  mv =  (18143)(11) = 199573 kg*m
Momentum of the Grand Rapids Bus = mv = (1182)(11) = 13002 kg*m

As you can see, the bus won this battle. It had way more momentum than the car and that's why I was injured so badly. The car was knocked back and smashed in badly. This was something I have always wanted to do. I just wanted to see how much more momentum the bus had than the car. I can't believe my injuries weren't worse.  


This is a perfect example for using a real life scenario in math. I know this is more of a physics problem, but physics always uses math. I think that I can use this example in other ways that will be more applicable to the math classes that I will be teaching in the future.


Tuesday, February 3, 2015

Give me the Details

I recently went into a high school classroom to observe an algebra 1 class and a geometry class. While I sat and observed, I thought back to when I was taking these classes in high school. Math was always so easy for me. In algebra 1, I never studied for exams, I was still the first one done on the exam, and I always got the best grade. In geometry I slept through a lot of classes and still got an A-.


As the class progressed I noticed, not surprisingly that some students were struggling with the material. I learned a lot from that day of observing. While the teacher was going over problems, she went over them step by step. There were no short cuts taken. Every step was put on the board and every step was clearly explained. Often times the teacher would ask the students what the next step was. They were not simply given the next step.

High school math teachers take much higher math classes than the ones they teach. By the time they get back to teaching the lower level math classes, most of the material is simple and easy. They know short cuts and tricks that can make the work for the problem shorter. They don't have to write out the work completely to find the correct answer. Students usually need more explaining. They need the teacher to fully explain a problem for them to completely understand it.


I have a few examples below that I can show from the class. I will show I could do it and how I would need to explain it to a student who has never seen the problem before

Algebra 1

Simplify the expression (x^2 * y^4 * z^5) *(y^2 * x^3 *z^1)

Me: Just by looking at it I know that the answer is (x^5 * y^6 * z^6)
All the work I do for the student I can do in my head. 

Student: In this I would have to explain that you can only combine like terms. When you multiply like terms you add powers. So:
x^2 * x^3 = x^5
y^4 * y^2 = y^6
z^5 * z^1 = z^6
There for the final answer is x^5 * y^6 * z^6

Thats how students feel

Geometry

Find the surface area of a cube that has a side length of 5 cm.

Me: I know the answer is 150 cm^2 because I know the properties of a cube. It has 6 sides with area 25 cm^2.

Student: I would have i explain to the student that the the sides of a cube are all the same. So the length, width, and height are all 5 cm. Also the students would need to know that there are 6 sides on a cube. No we add the area of each side of the cube to get the total surface area. We know each side is a rectangle so the area is width time height.

Side 1: 5cm*5cm = 25cm^2
Side 2: 5cm*5cm = 25cm^2
Side 3: 5cm*5cm = 25cm^2
Side 4: 5cm*5cm = 25cm^2
Side 5: 5cm*5cm = 25cm^2
Side 6: 5cm*5cm = 25cm^2

Total surface area = 150 cm^2

If the student can recognize the short cut and just do 25 * 6, then they should do it. If they don't feel comfortable then they should write out all the steps to the problem until they are comfortable with the shortcut.


As teachers we need to be able to effectively and clearly communicate with our students. They need to completely understand what we are teaching them. The best way to do that is by showing them all the details of a problem. Make them work it out step by step so their is no confusion. If there is till confusion then each step needs to be further explained or explained in a different way. If the students know how to do a problem step by step, they can eventually learn shortcuts and what steps they can remove from their process. Soon the concepts will be as easy to them as it is to us the teacher.


Monday, January 19, 2015

Math in Football

When thinking about the game of football, most people think about the great players and the great plays they make. Weather it's a big hit from Clay Mathews, a perfect throw from Tom Brady, or an incredible catch from Calvin "Megatron" Johnson. I doubt there are many people who think about the math and physics involved in the game of football. Almost every action and situation in the game of football can be broken down into mathematical components. Lets look at some positions where math shows up in football.

Quarterback

The QB position is the most important position in the game of football. It is the hardest position to play because the precision that is needed to complete passes. When you think about throwing a football, it is just like  projectile motion.


The equations for projectile motion are
Y=Yo + Vo*sin(a)*t+0.5gt^2

Y: vertical displacement of football
Yo: initial vertical displacement of football
Vo: initial velocity of football
a: angle at which the ball is thrown
g: acceleration due to gravity which is 9.8 m/s
t: time

X=Xo + Vo*cos(a)*t

X: horizontal displacement of the ball
Xo: initial horizontal displacement
All other values are the same as above

For the QB to throw the ball as far as possible, he must throw the ball at a 45 degree angle. That will be the perfect angle so the ball gets the most distance before it hits the ground. The average QB stands at 6'3''. The average QB can throw the ball about 60 yards. This means the average QB can throw the ball around 23 mph.

Receivers/Defensive Backs

For receivers and defensive backs, timing is everything. Receivers need to time their jumps, time their cuts in their routs, and time when they close their hands on the ball. Defensive backs also need to time their jumps and time when they try to swat the ball. The receiver also has to rely on the timing of the QB. The ball has to be thrown out in front of the receiver so that he can catch the ball in stride. If the receiver and the QB have good timing the below can happen:
                                                     

 The picture above is Randy Moss. In this picture he is "mossing" someone which is a term that he inspired. To "get mossed" means the receiver perfectly timed his jump so that he catches the ball when he reaches the highest point in his jump. Randy Moss made his career out of "mossing" defenders. When you think about it, you can mathematically calculate how to "moss" someone. The average receiver is around 6'3'' while the average DB is only about 5'11''. Both players have an average vertical jump of around 37 inches. If the receiver can time his jump so that he catches the ball while it is still 10+ feet from the ground (taking into account wingspan) he can successfully moss a defender. If not, the average DB will have a chance to knock the ball away for an incomplete pass.

Running Backs/Tacklers

The concept of tackling a running back with the ball is all about momentum. We know that the mathematical calculation for momentum is:

P=M*V

P: momentum
M: mass of the object
V: velocity of the object  

There are only three possibilities that can occur when a tackler hits a runner. Those three are:

1. Tackler run overs runner

 This will occur when the tackler has more momentum than the runner. This could be simply because the tackler is bigger or faster than the runner. He can generate more momentum and make the tackle.


2. Runner run over tackler

This will occur when the runner has more momentum than the tackler. This could also simply be because the tackler is bigger or faster than the runner. He can generate more momentum and will run the defender over. This does not mean he will break the tackle since the tackler can hold on. If a runner generates more momentum than a tackler, they will fall forward at least and gain a few more yards.
                                             

3. Neither player gets ran over

This will occur when both players have the same momentum. If both players have the same momentum then when they hit, they will not move. Often times this doesn't happen. Someone always gets pushed back. How is this possible if both players have the same momentum? Now is depends on where the players hit. There is a saying in football "low man wins". This refers to how low you hit someone. In reality it's how close you can get to someones center of gravity. The closer you are to that, the easier time you will have in moving an opponent backwards.


Football is a game for incredibly strong, fast, and athletic people. The game can be broken down into all kinds of physics and math that most people and players don't think about. A QB knows how hard, at what angle, and when to throw the ball. He doesn't often think about it, normally it's muscle memory. All other players do the same thing. They don't think about the specifics of the math and physics, but they use them their advantage to make plays and win games.